IT & Sysadmin
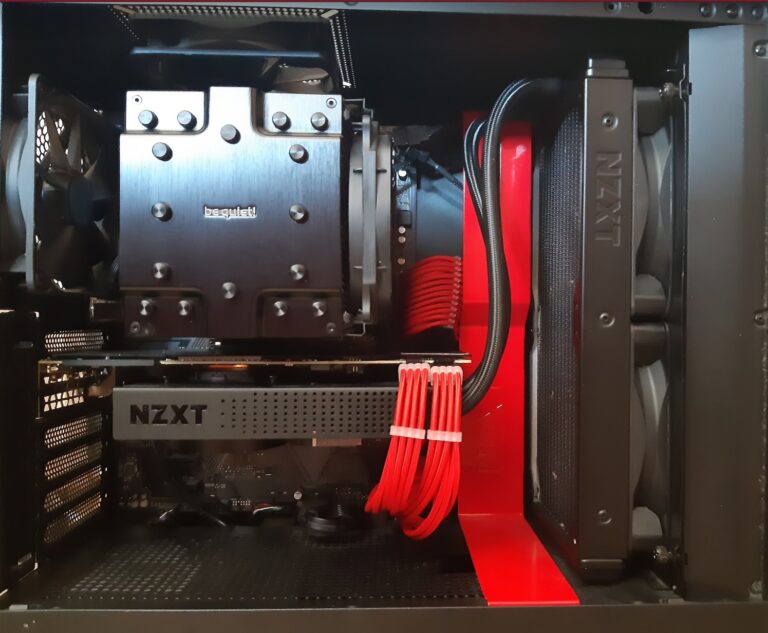
Today the main component — and also the most expensive — of any gaming PC is undoubtedly the GPU… and it is unfortunately also the noisiest one under heavy loads. In my case, having the PC in the living room, this was quite annoying to those around me when I used it for extended periods…
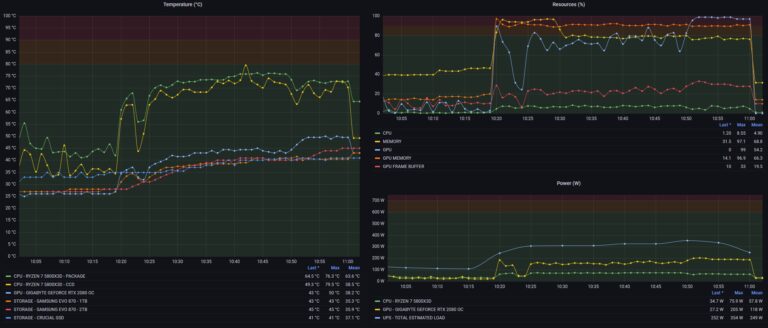
If you’re a PC gaming enthusiast, you know how important it is to get the best possible performance from your hardware. With the rapid evolution of games and technology, the need to optimise your computer to ensure not only excellent performance but also good component longevity has become crucial. This desire stems both from the…
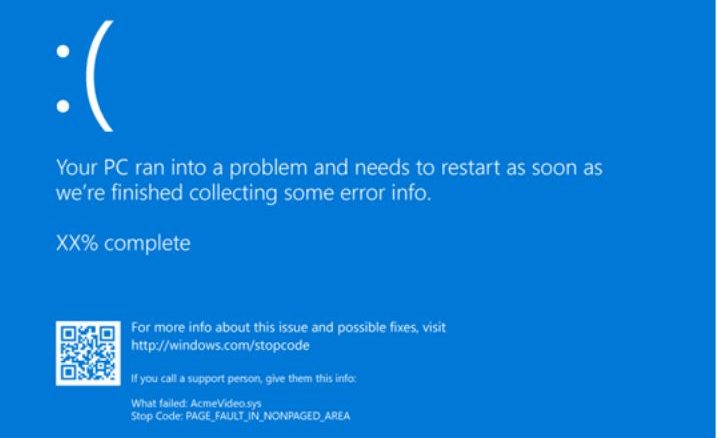
Sometimes workstations surprise us in the worst possible way: my Windows 10 Pro x64 machine started crashing completely unexpectedly. What followed was a systematic analysis that ultimately led to a precise hardware cause. These are the notes from that troubleshooting session. The Problem The crash manifested in different ways that gradually worsened over time. In…
A corrupted or missing transaction log file is one of the most stressful situations a DBA can face. The first instinct is to restore from the last full backup — but depending on the circumstances, SQL Server offers faster recovery paths that minimize both downtime and data loss. This article walks through the two main…
When troubleshooting a slow query or a specific application session, the instance-level wait statistics in sys.dm_os_wait_stats are too coarse: they aggregate wait events from all processes since the last restart. Resetting the view with DBCC SQLPERF is also problematic on busy instances where hundreds of other sessions generate noise. SQL Server 2008’s Extended Events framework…
SQL Server runs a lightweight background trace called the default trace that records a wide range of server-level events: database auto-growth events, object creation and deletion, login failures, server configuration changes, and more. It’s often the first place to look when investigating an incident that didn’t make it into the error log. This article shows…

When troubleshooting a slow or unresponsive MySQL instance, the first step is always the same: find out what is happening right now. These quick diagnostic queries use MySQL’s built-in SHOW STATUS and SHOW PROCESSLIST commands to surface the most useful information in seconds — no external tools required. 1. Active Processes and Running Queries SHOW…
SQL Server Agent jobs are the backbone of automated database maintenance: backups, index rebuilds, integrity checks, ETL pipelines. Knowing at a glance when each job last ran and how long it took is essential for fast daily monitoring, especially when managing multiple instances. This query reads directly from the Agent system tables in msdb and…
Indexes are one of the most powerful performance tools in SQL Server — and one of the most overlooked sources of overhead. Every index you create must be maintained on every INSERT, UPDATE, and DELETE operation. Unused indexes cost you disk space, backup time, memory, and write performance, without providing any read benefit. Finding and…
When troubleshooting performance issues on a SQL Server instance, the first step is always to understand what is happening right now: which queries are running, which sessions are blocking others, and where time is being spent waiting. These three T-SQL scripts give you an immediate picture of the current workload using Dynamic Management Views (DMVs)…
- 1
- 2